 LRW Honors Amtrak’s Acheson As Railway Woman Of The Year
 From Editor-In-Chief Foran: Of Gender Equity And Inclusion
 Spotlight On Some Of Today’s Rail Safety Products
 Women of Influence in Rail eBook
Stay updated on news, articles and information for the rail industry
October 2010
Rail News: Passenger Rail
Passenger Rail at a Glance: Transit Trends
The following charts reflect data gathered earlier this year by the American Public Transportation Association (APTA) showing how transit agencies are addressing budget issues caused by the recession. Based on a March 2010 survey, the results show that nearly all transit agencies are suffering revenue drops, service cuts, fare increases, and staff and pay reductions, with the impacts most severe at larger agencies. Meanwhile, public transit ridership in 2009 totaled 10.2 billion —the second-highest ridership figure in more than 50 years.
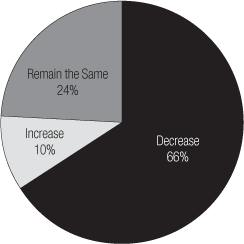
Changes in Local and/or Regional Funding in Current Year
Public transit agencies rely on three primary revenue sources to fund agency operations: local/regional revenue (collected through various tax and funding structures), state revenue and transit fares. APTA survey results show that 90 percent of agencies are facing flat or declining local and/or regional funding in 2010.
"I'm not saying you need huge increases every year, but agencies do need a little because the cost of doing business goes up and labor contracts go up," says APTA Vice President for Policy Art Guzzetti. "If you're not getting any more money from an important partner, that's an equation for trouble.
Transit Agency Actions to Address Recession Impacts
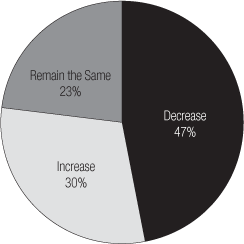
To address budget shortfalls, 74 percent of transit agencies either had implemented service cuts or were considering service cuts as of March 2010. In addition, 73 percent of agencies either had or were going to raise fares. Almost half of all transit agencies were forced to transfer funds from capital to operations and 40 percent have drawn from reserve funds, which could have a long-term effect on the condition of agency assets, APTA said.
| Implemented Since January 1, 2009, or Approved for Implementation |
Considering Future Action |
Implemented AND Considering Additional Future Action |
Implemented OR Considering for Future Action |
|
| Service Cuts: | 44% | 53% | 23% | 74% |
| Reduction in Peak-Period Service | 32% | 34% | 10% | 56% |
| Elimination or Reduction in Off-Peak Service | 35% | 38% | 11% | 62% |
| Reduction in Geographic Coverage of Service | 15% | 30% | 5% | 40% |
| Fare Increase | 44% | 34% | 5% | 73% |
| Fare Increase AND Service Cuts | 28% | 23% | 4% | 48% |
| Fare Increase OR Service Cuts | 59% | 61% | 36% | 84% |
| Transfer of Funds from Capital Use to Operations | 49% | 18% | 13% | 54% |
| Use of Reserves | 40% | 23% | 7% | 56% |
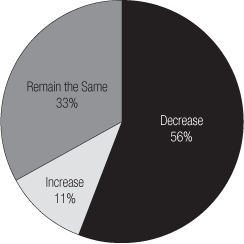
Changes in State Funding in Current Year
In total, 89 percent of the agencies that responded to APTA's survey said they are facing flat or declining state revenue. Larger agencies — those that provide more than 25 million annual trips — are facing a higher proportion of declines in state and local revenue. As a result, 54 percent of large transit agencies have cut peak-period service and 31 percent have reduced the geographic coverage of service, according to APTA. In addition, almost seven in 10 have transferred funds from capital to operations and 54 percent have been forced to dip into agency funding reserves.
Changes in Fare Revenue in Current Year
Many transit agencies have addressed declining revenue, in part, by increasing fares. However, with unemployment levels lingering around 10 percent, fewer people have been going to work, resulting in less farebox revenue, says APTA Vice President for Policy Art Guzzetti.
Agency Personnel Actions to Address Recession Impacts
In APTA's March 2010 survey, more than half of the responding transit agencies reported a reduction in the number of positions, either through attrition or layoffs. About one in three agencies had laid off workers. Seven agencies had laid off 100 or more employees and of those, four had more than 250 layoffs. Staff cuts were most common at larger transit agencies, with 80 percent reducing positions and 57 percent laying off workers. Agencies also reduced salaries and employee benefits in an effort to help balance their budgets.
| Implemented Since January 1, 2009, or Approved for Implementation |
Considering Future Action |
Implemented AND Considering Additional Future Action |
Implemented OR Considering for Future Action |
|
| Hiring Freeze | 41% | 18% | 5% | 54% |
| Furloughs: Non-Union | 23% | 16% | 3% | 36% |
| Furloughs: Union | 11% | 15% | 1% | 25% |
| Salary Freeze or Reduction: Non-Union | 52% | 20% | 9% | 62% |
| Salary Freeze or Reduction: Union | 23% | 22% | 3% | 42% |
| Reduction in Benefits: Non-Union | 25% | 25% | 4% | 46% |
| Reduction in Benefits: Union | 17% | 25% | 3% | 38% |
| Reduction in Positions | 53% | 30% | 15% | 68% |
| Layoffs | 32% | 22% | 7% | 47% |